June 2026. A research write-up, not betting advice.
I built a simple soccer model, published it as an interactive page, and spent three weeks testing whether it had a betting edge. It does not. The negative result measures how efficient these betting markets are.
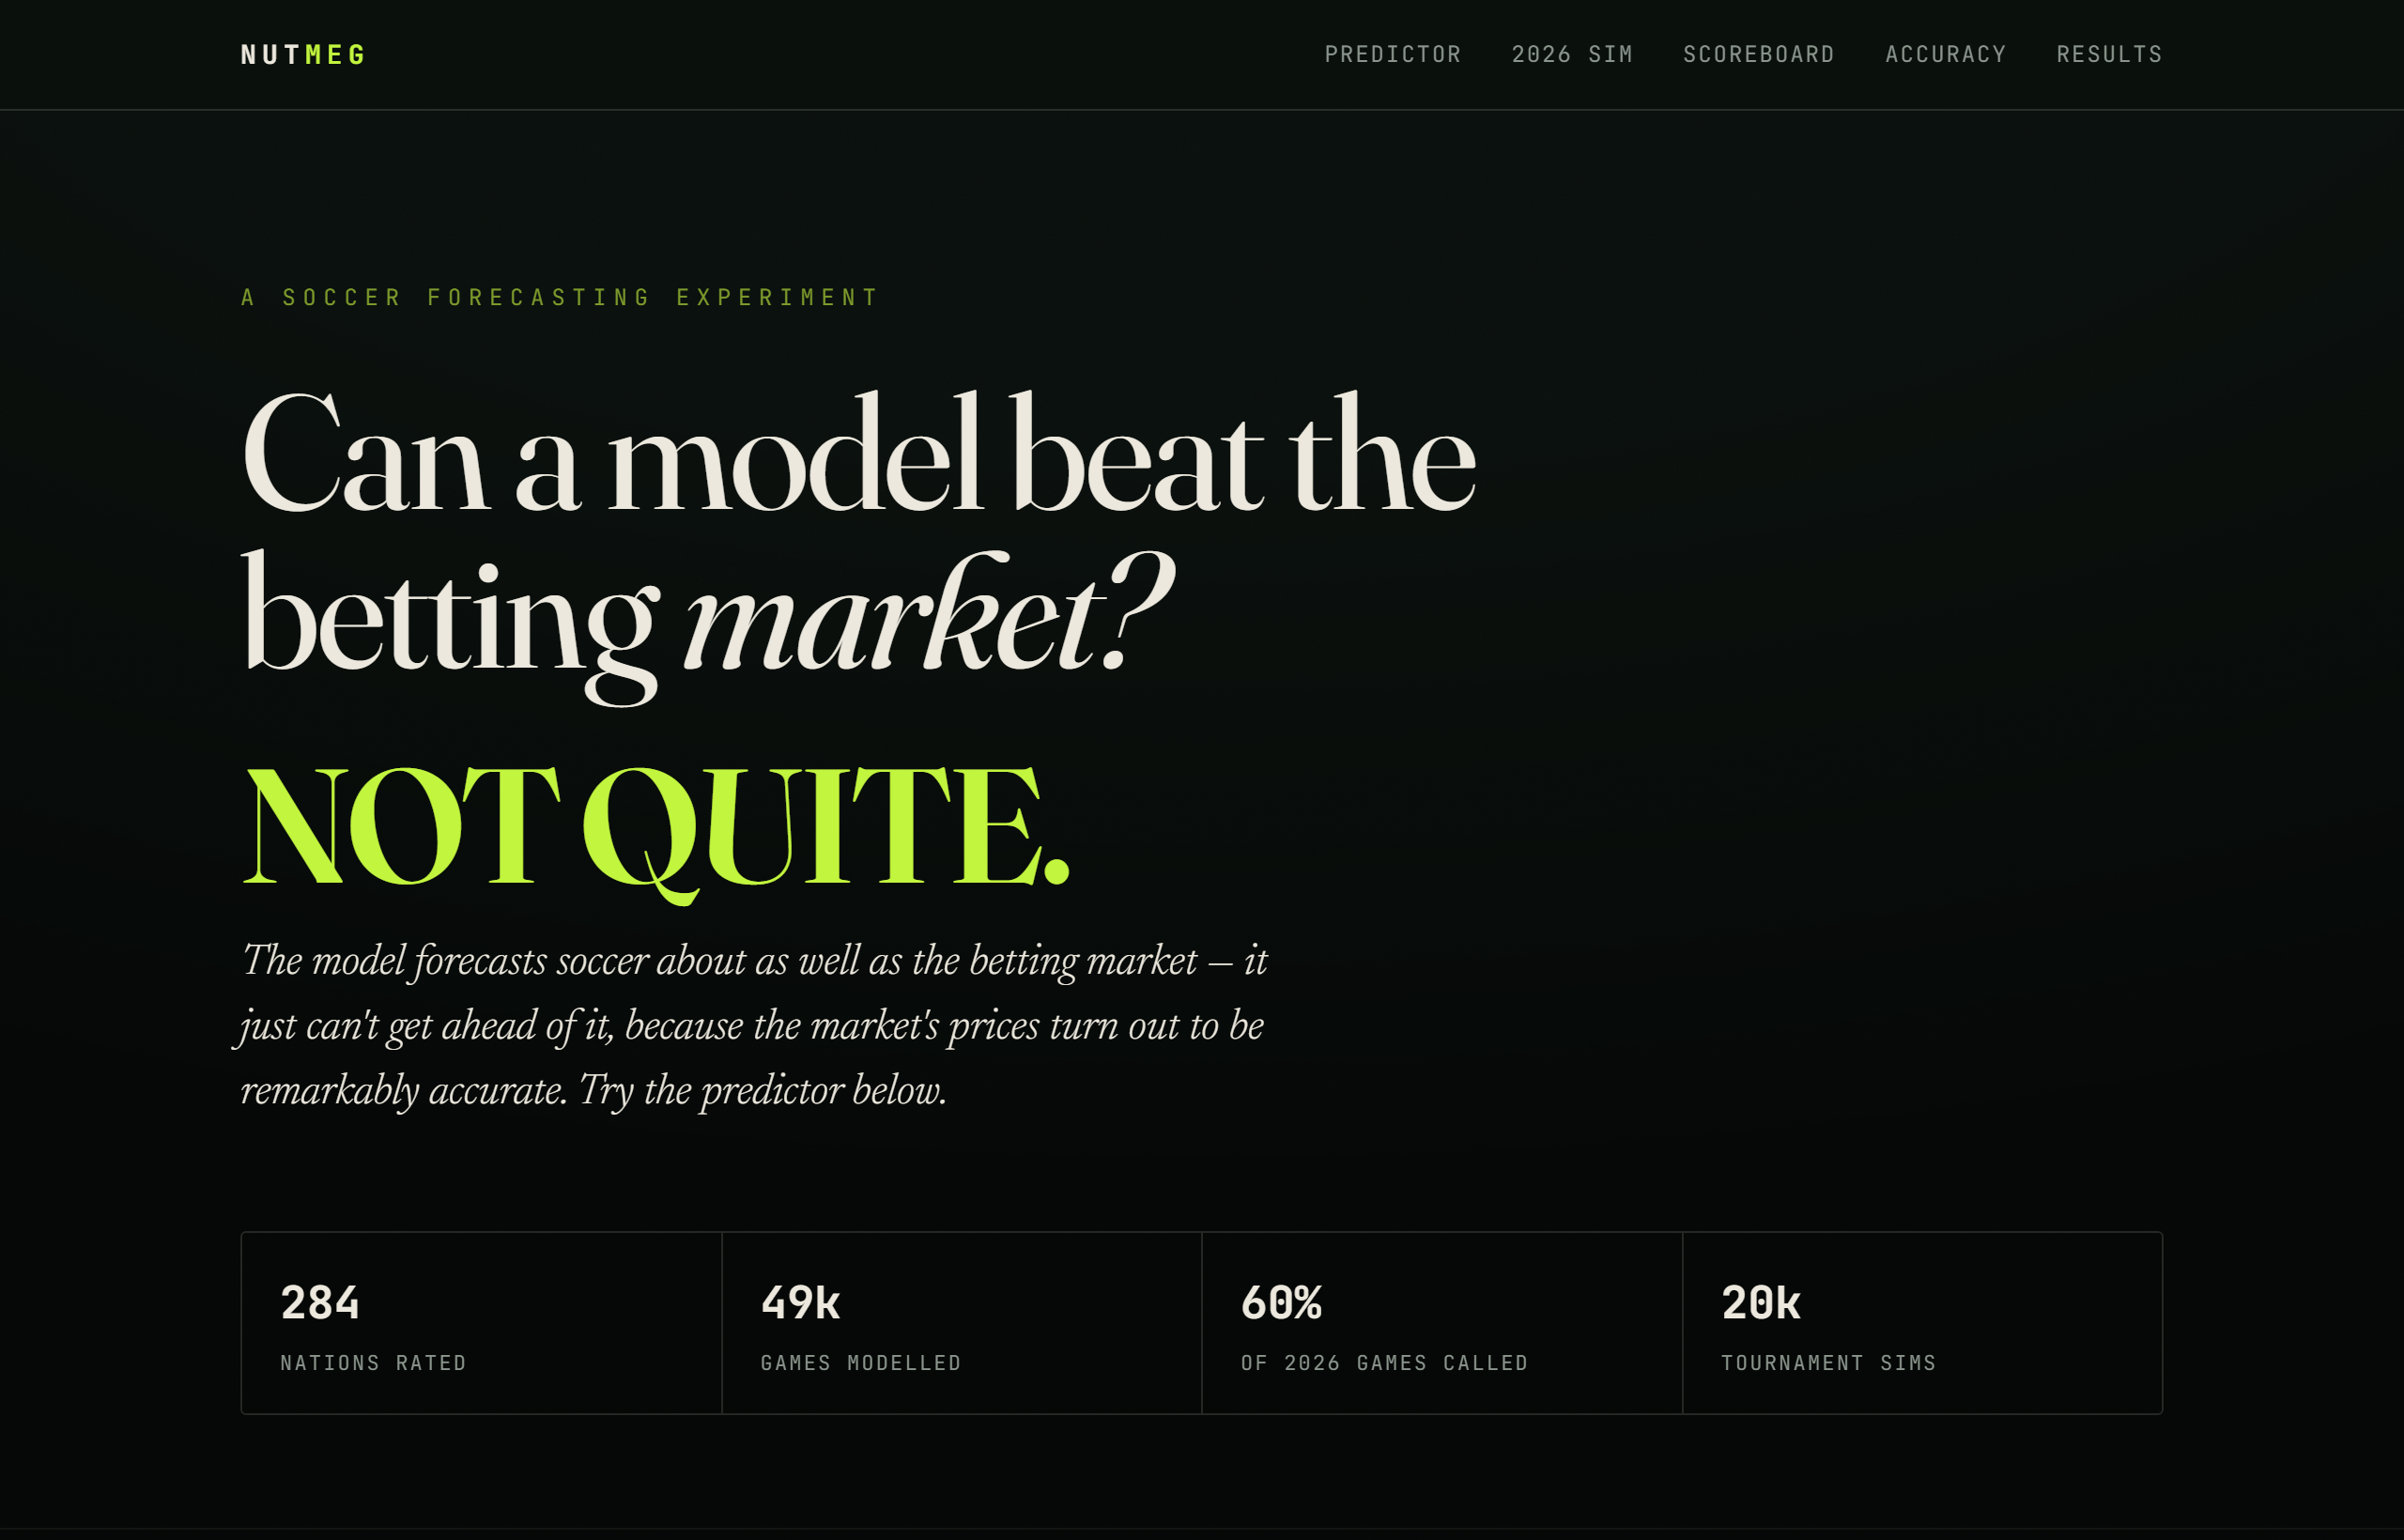
Try the live version → Pick any two nations and see the model’s odds, or play out the rest of the 2026 World Cup twenty thousand times. The predictor runs the actual model in your browser.
The test that matters
Prediction accuracy is the wrong measure. A model can predict most results correctly and still lose money, because the bookmaker’s price already reflects who is likely to win and carries a margin on top. The test that matters is whether the model beats the closing line, the last price before kickoff, after every public model and all informed money have moved it. A model that beats the closing line has an edge. A model that does not loses at the rate of the margin, regardless of how many results it gets right. I committed the success criteria to git before running anything, and measured closing line value — did the price drift toward my bet after I placed it? — rather than raw profit, which rides on luck in any single match.
The model
Plain Elo: one rating per team, adjusted after each result, with a separate adjustment for draws, and matches processed in date order so the model never sees a future result. No player data, no injuries, no xG. The goal was to measure how far a minimal model gets.
What I ran it against
The five big European leagues — ~24,000 matches with real Pinnacle closing odds from football-data.co.uk — then, for the World Cup, national teams off martj42/international_results (every international back to 1872), checked against live Kalshi and Polymarket prices.
What happened
The club-league test lost money: over 4,099 bets, closing line value −3.4% with the entire confidence interval below zero, and ROI −9.8%. The loss was steady and close to the size of the bookmaker’s margin. I then measured how accurate the market itself is: across 73,000 predictions the prices tracked outcomes to within about half a percent, so a stated 30% chance occurred about 30% of the time. The one known exception, the favourite-longshot bias, is small enough that the margin cancels it; betting heavy favourites at the close lands near break-even. The World Cup test produced the same result: a well-calibrated forecaster, correct on about 69% of historical knockout games, with CLV against Kalshi indistinguishable from zero. A +51% profit reading was noise, and random betting produced a comparable result over the same small sample.
The twelve disagreements
I took the twelve bets where the model disagreed most with the market and had a set of agents research each. In every case the model was wrong. Sometimes this was a known flaw, since it overrates teams from weaker confederations. More often the market held information the model did not have: a key player injured (Japan’s Mitoma), a side already qualified and resting players (Mexico), two red cards carried over (Qatar), and Iran’s travel and recovery schedule.
What it means
A simple model cannot outperform an efficient market, because the price already aggregates the best available estimate. Betting against the price is usually wrong, and betting with it pays the margin; both have negative expected value. An edge is unlikely at the World Cup, which is one of the most heavily traded events in sport. It is more likely in small, thinly traded markets, and only with information the price does not already contain, which for soccer means mostly player-level data collected carefully enough to avoid hindsight bias. I have not done that. It would have to clear the same bar: positive CLV on data the model never saw.
Tournament simulation
Run the rest of the 2026 tournament 20,000 times and the model ranks Argentina first at around 22%, followed by Spain and France. That is a one-in-five probability, produced by a model this post has just shown has no edge against the market price.
Model: plain Elo, draws handled, strictly date-ordered so it can’t peek ahead. Data: ~24,000 club matches with Pinnacle closing odds, every international since 1872, live prices from Kalshi and Polymarket. Method: success criteria pre-registered in git, CLV as the headline metric, 73,000 calibration checks, agent research on the twelve biggest disagreements.