A companion to Testing a Trading Bot with Real Money, which reports the live-trading results of a backtested strategy. This post catalogs the strategies that failed testing.
Twenty-five strategy files and dozens of indicators. Most produced a positive backtest in at least one window and failed outside it. The catalog below is grouped by failure mode rather than by indicator.
Results specific to the test window
A volume filter — trade only when volume is in the top 40% of recent bars — returned +8.9% over thirty days against +2% unfiltered, at a profit factor of 2.25. Over six months the difference disappeared: the filter fit the thirty-day sample rather than a persistent pattern. A time-of-day gate that traded only the opening and power hours returned +103% at a Sharpe near 3 over six months of two-minute bars. On one-minute bars the same rule returned a large negative. The top five days produced more than the strategy’s full-period total, and the other thirty-eight days combined lost money. A short backtest on a trending asset measures the behavior of that window and does not establish an edge.
Results that do not survive transaction costs
VWAP reversion, opening-range breakout, and a long-short version of the same signal were all positive at zero assumed cost and all negative once I applied realistic commission and slippage. VWAP reversion fell to −81%, the breakout to −32%, and the long-short from +149% to −18.8% on identical trades. Their entire backtested profit came from the zero-cost assumption, and costs dominate returns at one-minute holding periods.
Win rate as a misleading metric
Buying when RSI drops below 30 won 60% of trades and returned −77%. Selling above RSI 75 raised the win rate from 41% to 56% and lowered returns. A high win rate generally comes from taking profits early while losses run to the stop, which puts the average win below the average loss. When a change raises the win rate, I check the distribution of trade returns before accepting it.
Returns concentrated in a few trades
On the leveraged ETF KORU, a “smart dip entry” returned +64%, 15 points above buy-and-hold. Three trades produced 42 of those 64 points. Further optimization on that window fits the parameters to those three trades. I now measure how much of a total return comes from the largest few trades.
My highest-Sharpe result was leveraged buy-and-hold
Adaptive Leverage Hold scales exposure up in strong trends and down in weak ones. It returned +277% against +97% for buy-and-hold, at a Sharpe of 8.39, and held across eleven parameter perturbations. The rule never exits: it varies leverage between 1x and 2x on an asset that rose over almost the whole test window. That makes it leveraged buy-and-hold, measured over a period in which leveraged buy-and-hold outperforms by construction. My first check on a high-Sharpe result is now whether the position is ever flat, and how much of the return is directional market exposure.
Exit rules with no measurable effect
Several exit rules had no measurable effect on results. A fixed trailing stop fired seven times over a hundred exits and left the total return unchanged to within rounding. An ATR-adaptive trail was overwritten on every exit by the regime-break exit. A breakeven stop never armed in live trading. A time-based stop never met its trigger conditions. A scale-out ladder that sold into strength underperformed a plain trailing stop by 34%, because it reduced position size on winning trades to realize small gains. I now instrument a new exit rule to confirm it fires at all before measuring whether it improves results.
The regime models
A hidden Markov model fit the training data closely, with well-separated regimes and 98–99% state persistence. On out-of-sample data the most bullish state’s next-move return was negative. The regime structure was present in the training data and did not reproduce out of sample. In-sample fit quality is not evidence that a model generalizes.
What held up out of sample, and why none of it is a day-trading strategy
The volatility tools held up: a big-move radar, a freefall detector, and a regime gauge that flagged elevated risk three days before a major crash. Each estimates the magnitude of the next move and carries no directional information, which makes them usable for position sizing and risk limits but not as entry signals.
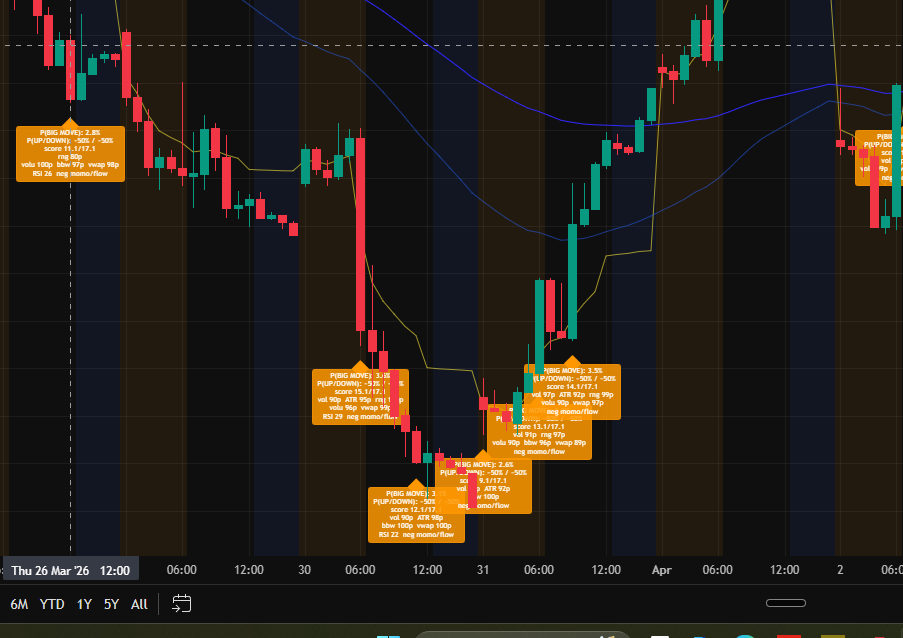
Big-move radar output. Volatility, RSI and order flow all indicate an elevated probability of a large move, and the direction estimate stays at fifty-fifty.
One strategy also held up: a slow trend rule on the unleveraged sector fund returned +983% over five and a half years against +516% for buy-and-hold, at half the drawdown. It avoids the drawdowns that require a 3x fund to gain 900% to recover. It trades about seven times a year, which is why it is the one validated edge in this catalog that I have not put into production.
Two dozen indicators, and most of them measured what they claimed to measure. The patterns were present in the data and computed correctly, but none held across a different test window, a realistic cost assumption, or a check on which trades produced the return. None of them produced an edge after costs.