My backtest showed +121.82% in three months, beating buy-and-hold by thirty points. I spent real money finding out if that was true.

Here’s the whole story in one paragraph. I built a trading bot for SOXL, a fund that moves three times as fast as the semiconductor stocks it tracks. My backtest said the strategy would have made +121.82% in three months, comfortably beating buy-and-hold. I could have just trusted that number. Instead, I decided to test it for real — with proper infrastructure, careful tracking of every trade, and a large sum of my own money in total. The test took three weeks, four hundred backtests, and a few painful production incidents. By the end, I understood my backtest far better than I wanted to.

TradingView backtest for the SOXL strategy: +121.82% total return ($30,455) over an 88-day window versus +91.09% for buy-and-hold, a profit factor of 2.70 and a 51.65% win rate across 91 trades

The backtest that made me go all in: +121.82% in 88 days, beating buy-and-hold’s +91%. This is what a strategy looks like right before you add the cost of trading.

If you don’t care about the technical details — how the bot works, how I tested it, all the creative ways it tried to hurt me — you can stop reading here, honestly. You won’t miss much: the one practical lesson is near the end, and you’re welcome to jump straight to it. The rest is for people who enjoy watching a backtest get questioned until it confesses.

Problem

It started, like a lot of bad financial decisions, with a backtest that looked too good to ignore.

TradingView lets you write a trading strategy and replay it against historical data. Mine — fair-value-gap entries confirmed by a trend filter, on one-minute bars of SOXL — came back showing returns no sane person leaves on the table. The strategy tester was adamant: this would have made a small fortune.

SOXL is a 3x leveraged semiconductor ETF. On a normal day it moves 5 to 10 percent; on a wild one it can swing 30. My thesis was simple: with that much daily movement, even a small, reliable edge in direction would compound into serious money — if I could react fast enough and consistently enough to capture it. A human can’t stare at a one-minute chart for eight hours and execute without hesitation. A bot can.

So the project had a clean shape. Build an automated trader that reacts to those supposedly crazy backtest returns — listens to the strategy’s signals and executes them in the live market, faster and more disciplined than I ever could by hand. Point it at real money. Then find out whether the returns were real, or whether the backtester was just telling me what I wanted to hear.

That last question turned out to be the whole project.

Design

Here’s the machine I built to answer it.

The pipeline

The flow: TradingView watches the chart and fires an alert, the alert hits my server as a webhook, and my server places the order with the broker (Alpaca).

The tricky part is that webhook alerts are unreliable by nature. They can arrive late. They can arrive twice. Sometimes they don’t arrive at all. So the server is built around a few simple rules. It answers the webhook immediately and does the actual trading work in the background, so nothing times out. It never trusts its own memory about what it holds — it always asks the broker, because the broker’s records are the only thing that survives a crash or restart. And if the same alert shows up twice, the second copy gets recognized and ignored instead of doubling my position.

flowchart TB
    TV["TradingView<br/>Pine strategy fires an alert"]
    TV -->|webhook| NG[nginx]
    NG --> LIVE["Flask · LIVE<br/>real money"]
    NG --> PAPER["Flask · PAPER<br/>mirror"]
    NG --> TEST["Flask · TEST<br/>canary"]
    LIVE -->|marketable-limit orders| AL[("Alpaca<br/>broker = source of truth")]
    PAPER --> AL
    TEST -->|"tiny round-trip every 30 min"| AL
    AL -.->|"position state, checked on every decision"| LIVE
    LIVE -.->|"fills · errors · /panic"| TG([Telegram])
    TEST -.->|"buzzes my phone if the round-trip fails"| TG

Three identical stacks, one source of truth, and a canary that actually trades.

Smart orders, never market orders

The bot never sends market orders. On a fast-moving 3x fund, a market order is a blank check — you’re agreeing to pay whatever the market asks in that moment. Instead, every order is a limit order placed just past the current price. If it doesn’t fill, the bot cancels and re-places it slightly more aggressively, stepping up in stages: 0.025%, then 0.1%, 0.25%, 0.5%, and finally 1%. That last number is a hard ceiling. No matter how fast the market is moving, the worst price I can pay is 1% past where I aimed — not because I hope so, but because the order types make anything worse impossible.

Staying alive around the clock

Then there’s the part nobody ever backtests: keeping the thing healthy 24/7. Three copies of the system run side by side — one trading real money, one paper trading, and one test instance whose only job is to place and close a tiny real order every 30 minutes, all day, every day. If that round-trip ever fails, my phone buzzes. A heartbeat signal alerts me if the process goes silent. Every fill and every error lands in a Telegram channel, labeled by environment. There’s a /panic command that sells everything from my phone. Margin stays disabled unless I deliberately flip a config flag. And after one painful lesson, every deploy is a git pull into a symlink and nothing else — no copying files by hand, ever. Plus 54 unit tests that run against a fake broker, because the real broker’s sandbox is far too polite to produce the failures that actually matter.

An exit that knows what time it is

Exits get the same care as entries. A trailing stop guards every position, but it adapts to the clock: during regular market hours it rests a real, native stop order on the exchange, so the protection survives even if my server dies; in extended hours — where the broker’s native stops simply don’t trigger, a fact most people learn the expensive way — it switches to a hidden software trail that tracks the position’s high-water mark internally and fires its own exit. It ratchets up, never down.

flowchart TB
    POS["Open position<br/>track the high-water mark"] --> CLK{"Market hours?"}
    CLK -->|"regular hours"| NAT["Native stop-limit<br/>rests on the exchange<br/>survives my server dying"]
    CLK -->|"extended / overnight"| SOFT["Hidden software trail<br/>(native stops don't fire here)<br/>server watches and exits"]
    NAT --> UP["Trail only ratchets up — never down"]
    SOFT --> UP

The same protection, delivered two different ways depending on who’s awake to honor it.

Testing

With the bot live and real money on the line, the testing began — though at first I didn’t think of it as testing. I thought of it as winning.

Three green days

For the first three days, I was a genius. The bot made money on a day SOXL closed down 5%. I scaled up.

Here’s the problem I didn’t want to see at the time: three winning days on a leveraged fund during a bull market proves nothing. The results would look exactly the same whether my strategy was smart or just lucky. There’s even a note in my own session log from that week that says “your good run is mostly regime, not edge” — in other words, the market is making you money, not the strategy. I filed it under things to think about later.

Following the money

The chart kept going up. My account didn’t. So I built a tracking system to figure out who was actually losing the money.

Every order got tagged with its source, and profit and loss got split into three buckets: trades the bot did entirely on its own, trades I made manually, and mixed trades — where the bot entered and I closed the position by hand. The accounting matched every sell to its original buy, lot by lot, because rough per-order math gives different answers when positions overlap, and the entire question here was who to blame.

Thirty days of data later: the bot’s own bucket won 40.9% of its trades and lost money steadily. The mixed bucket — same entries, but with me deciding when to get out — won 77.8% of the time and was profitable. Same entries. Different exits. Completely different results.

I spent a week tuning the bot’s exit logic. Everything I tried made it worse. That’s when I started suspecting the problem was deeper than the exits.

Two parameters

TradingView’s backtester has two settings that default to zero: commission and slippage. In other words, unless you change them, your backtest assumes trading is free.

Mine were unset. They had been unset the entire time.

I set them to realistic values and re-ran the tests. One backtest that had shown +62% became −11.3%. Same entries, same exits, just with the real cost of trading included. Another that had shown +175% dropped to −52%. Every gorgeous number I owned was resting on the same buried assumption: that trading is free.

The math I should have done on day one goes like this. A typical one-minute bar on SOXL moves about 0.003%. A complete round trip — buy plus sell — costs roughly 0.1% to 0.3% once you count the spread, the repricing, and the four seconds (I measured it) an alert takes to reach my server. So every single trade starts out 30 to 100 bars’ worth of expected movement in the hole. The strategy on top barely matters at that point. No strategy that holds for a few minutes can climb out of a hole deeper than the move it’s trying to catch.

The autopsy

At this point a reasonable person stops. I wanted a proper autopsy instead — proof, not vibes.

I pulled a full year of one-minute price data, 238,359 bars, and wrote my own simulator in Python. The costs in it weren’t guesses: I used the alert delay I’d actually measured, the execution costs from my actual live fills, and the spreads I’d actually observed. Then I checked my simulator against TradingView’s own tester until the two agreed almost exactly — 277 trades versus 279 on the same setup. That step matters more than it sounds: if your simulator can’t reproduce the wrong answer, you have no business trusting it about the right one.

Then I tested everything. About 400 versions of the strategy — every filter and threshold I’d been hand-tuning for weeks — each run at five different cost levels, with each filter also switched off one at a time to see whether it actually contributed anything. Testing 400 variants creates its own trap, though: try enough things and something will look great by pure luck. So nothing counted as real unless it also worked on data it hadn’t been tuned on.

flowchart TB
    BT["Live strategy<br/>+62% backtest"] --> SIM["Rebuild as a Python simulator<br/>real costs: latency · spread · fills"]
    SIM --> REC{"Matches TradingView?<br/>277 vs 279 trades"}
    REC -->|"no — fix the simulator"| SIM
    REC -->|yes| GRID["Sweep ~400 configs<br/>× 5 cost levels<br/>+ leave-one-filter-out"]
    GRID --> OOS{"Survives unseen data<br/>AND beats a coin flip?"}
    OOS -->|no| DEAD["Discard — it was luck"]
    OOS -->|yes| KEEP["Keep — a real candidate"]

Every claim had to clear the same gauntlet. Almost nothing did.

The results. The best version of the strategy, at realistic costs, made +31% for the year. Just buying and holding made +1013% that year. The strategy I’d actually been running, simulated honestly: a 25.1% win rate and −96.8%.

And then the experiment I’d tattoo on my eyelids if I could. I ran completely random entries — coin flips — through the same simulator, over the same 90 bull-market days my beautiful +62% backtest came from. Twenty different random runs. Their average result: +39%. The best random run: +63%. My +62% strategy was indistinguishable from flipping a coin in a bull market.

For completeness, I tried fancier tools too. A hidden Markov model that found beautiful market regimes in its training data and predicted nothing on new data. A machine-learning classifier that called the next move correctly 52.1% of the time — when always guessing “up” scores 52.5%. At the one-minute scale, direction is noise. Nothing I tried could read it, including me.

I catalogued all ~400 of those experiments — sorted by the specific way each indicator fooled me — in a companion post: The Indicator Graveyard.

The creative ways it tried to hurt me

The statistics took weeks to settle. The engineering failures were more punctual. A few favorites:

  • The bot’s entry code canceled all open orders before checking whether it already held a position. So when a duplicate alert arrived, the duplicate got correctly rejected — but not before it had already deleted the stop order protecting my position. Nothing bad happened in that minute. “Nothing bad happened” and “nothing was wrong” are different things.
  • My emergency sell-everything command got blocked by my own safety net. The protective stop order resting on the exchange had reserved all my shares, so the broker refused the sell: nothing available. The seatbelt was holding me inside the burning car.
  • My end-of-day close-everything logic was set to run between 8pm and 4am. Pine scripts only run when a new price bar arrives — and SOXL doesn’t trade between 8pm and 4am, so there are no bars then. My safety rail was code that could never execute, and I found out by holding a position overnight that I never should have had.
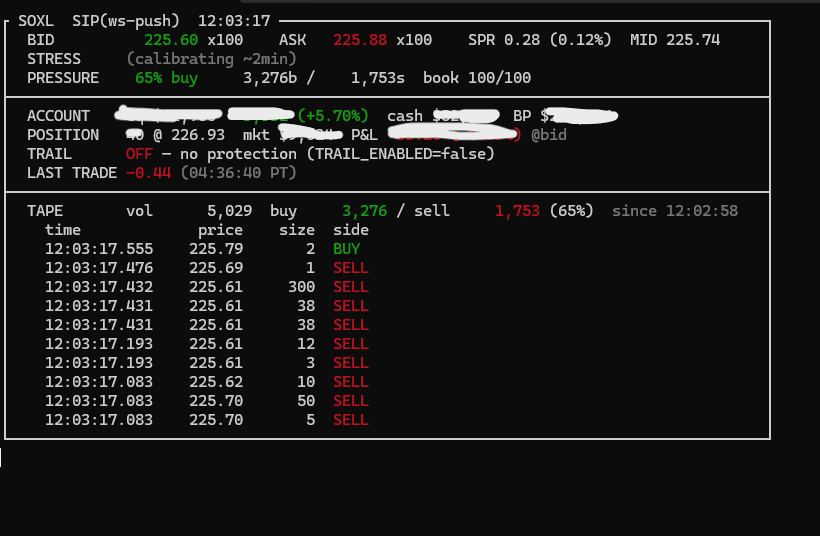
  • I once got filled at a price the chart said never happened. Charts show the last trade; your buy order pays the asking price; and at 1am the gap between those two was over 1%. That one fill is why the project now has a live order-book dashboard that knows which of the three US trading venues is awake at any given hour — because your data is lying to you whenever you ask a sleeping venue for prices.

A custom live trading terminal for SOXL showing the order book up top — bid, ask, spread and 65% buy pressure — above a time-and-sales tape where every individual print is timestamped and tagged buy or sell. Account dollar figures are blacked out.

The dashboard that bug paid for: a live tape that timestamps and tags every print and tracks which venue is actually awake. Account figures blacked out — the prices and the tape are real.

Results

What survived

Direction was unpredictable by everything I threw at it, me included. But two things did hold up on fresh data.

First: you can’t predict which way the price will go, but you can predict when it’s about to move big. Volatility signals raised the odds of a large move by two to three times. The first 15 minutes of the trading day carry roughly ten times the normal chance of a 5% move. A big overnight gap meant an 84% chance of a wild day. The market won’t tell you the direction — but it will tell you when to pay attention.

Second: one strategy genuinely beat buy-and-hold once risk was accounted for, and kept working on data it had never seen — a slow trend-following rule on the ordinary, unleveraged version of the same sector fund. It trades about seven times a year.

I rejected it for being boring. I’m aware of how that sounds. The results and my preferences disagree, so I wrote the results down somewhere my preferences can’t quietly edit them.

The night shift

I found out SOXL trades overnight the way I found out most things in this project: by accident, with money on the line. A leftover limit order filled at 8:19pm on a Sunday. The stock market is famously closed on Sunday nights — except, it turns out, there’s an overnight venue called Blue Ocean (BOATS) that runs from 8pm to 4am Eastern, my broker routes orders there by default, and almost none of the standard data feeds will tell you what’s happening on it. My main feed cheerfully reported Friday’s closing price all weekend while the real overnight price was twelve dollars away. The bot once got stuck in a position because of exactly that: it kept pricing its exit off a quote frozen at Friday’s close, and the broker kept rejecting it as nowhere near the actual market.

Here’s the thing I eventually understood: that gap isn’t a bug in the universe. It’s the business model. At 1am there’s no consolidated market, little competition, and very few participants — so the spread, a fraction of a penny at noon, opens up to a full percent. Whoever quotes both sides of that spread at 1am collects it from everyone who crosses it, and the people crossing it are mostly retail night owls chasing a move on their phones. I know, because I was one of them; that’s what my $2.10 fill was. For a while I seriously considered switching teams and running a small market-making bot overnight. The math killed it: market making is a game where you collect pennies until one stale quote during a futures move erases your week, and the firms playing it professionally have faster data, deeper inventory, and a risk desk. I was not going to out-quote them with a Flask server. But the lesson stuck, because it’s the same one my experiment had already proven from the other side: at short timescales, the durable money is made from structure — spreads, fees, flow — not from predicting direction.

The open question I’m chasing now is lead-lag. SOXL is mechanically three times a semiconductor index: in theory it can’t have information of its own, because its fair price is computed from other prices. Overnight, though, SOXL trades while most of what it tracks barely does. So where does its price actually come from in those hours? How fast does it snap back to the underlying when real information arrives, and is the lag measurable? That’s what the order-book and tape infrastructure is really for now: every print, timestamped and tagged buy or sell, lined up against the things SOXL is supposed to follow.

And that’s where the next research project starts: hidden Markov models, again — but pointed at different data this time. Earlier I mentioned an HMM that found beautiful regimes in price bars and predicted nothing on new data. The autopsy explained why: bars are summaries, and the summarizing throws away the order flow where any real information would live. So the next model doesn’t get bars. It gets the raw tape — every quote, every trade, buying and selling pressure measured directly — and its job isn’t predicting direction. It’s recognizing what state the market is in: quiet, loaded, one-sided, about to get interesting. Maybe there’s nothing in that either. But the validation gauntlet from this project is already built and waiting for it — out-of-sample splits, a cost floor any effect has to clear, and a coin-flip control with no feelings. The backtest fooled me once. It won’t get the same opening twice.

Where it landed

In the end, my live account did roughly what the honest simulator said it would. That’s a backhanded kind of victory, but it’s a real one: the whole point of building careful infrastructure is that your simulation and your reality agree, and most hobby algo traders never find out whether theirs do.

The direction-predicting bot is finished. Not paused while I tune it — finished, the way a question is finished when it’s been answered. A year of data, a verified simulator, 400 configurations, and a coin-flip control all say the same thing, and I checked the bottom of that search space personally.

What’s still running is everything else — and it adds up to something I didn’t plan. The reprice ladder, the clock-aware trailing stop, the attribution system, the order-book tape: together they’re a genuinely robust trade executor, smarter than the strategy that used to drive it. The new framing writes itself: at short timescales, trading is an execution-and-costs problem, not a prediction problem. I now own very good machinery for exactly that problem.

If you’re about to build one of these, let me save you three weeks: go set the commission field in your backtester to something honest before you write a single line of strategy. Everything in this post is downstream of that field defaulting to zero.

The boring strategy that actually works is still sitting in a file, validated and unloved, trading seven times a year in a universe where I’m someone slightly more patient. I think about it more than I’d like.


Stack: Python, Flask, nginx, systemd, Alpaca API, TradingView Pine. Operations: three isolated environments, a synthetic test trade every 30 minutes, dead-man heartbeat, alerting to Telegram. Method: a year of one-minute data, ~400 configurations across five cost levels, 20 random-entry control runs, out-of-sample validation, simulator verified against TradingView’s own tester. Full technical report available on request.